E-commerce Sales Analysis Dashboard
Comprehensive Power BI dashboard analyzing e-commerce performance with SQL-based data modeling and DAX measures for revenue tracking and customer segmentation.
Overview
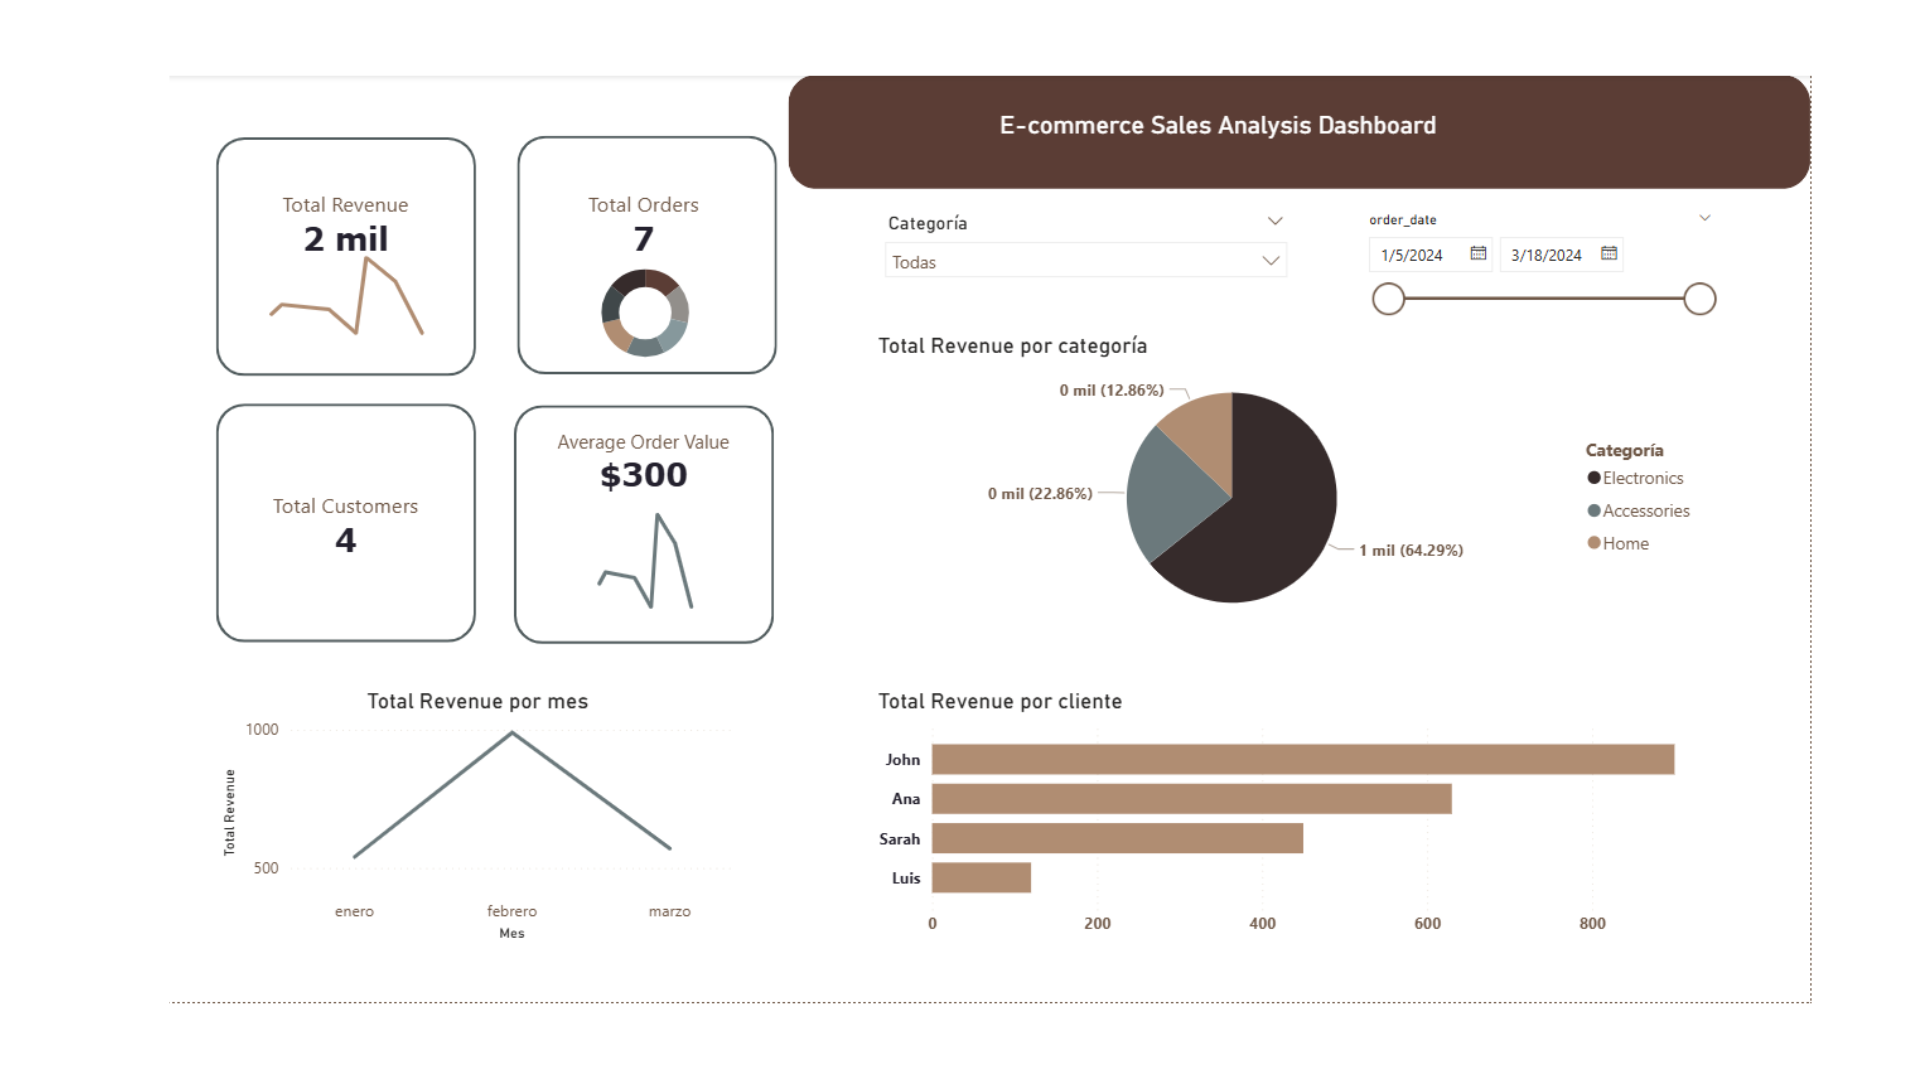
Developed a comprehensive Power BI dashboard to analyze e-commerce sales performance, consolidating data from multiple sources to provide actionable insights for business decision-making. The dashboard tracks key metrics including revenue, orders, customer behavior, and product performance.
The Challenge
- Sales data scattered across multiple databases and CSV files
- Manual reporting process taking hours each week
- Difficulty identifying top-performing products and customers
- No visibility into revenue trends and seasonal patterns
- Limited ability to segment customers effectively
Solution
- Built SQL-based data models consolidating multiple data sources
- Created DAX measures for revenue calculations and time intelligence
- Implemented customer segmentation by value and purchase frequency
- Developed product category analysis with profitability metrics
- Added dynamic filters by date range, category, and customer segment
- Automated data refresh reducing manual reporting by 40%
Technologies Used
Key Insights Delivered
The dashboard enabled stakeholders to quickly identify revenue trends, high-value customers, and underperforming product categories. Dynamic filtering allowed for deep-dive analysis by time period, category, and customer segment.