Social Media KPI Dashboard for Chargex
Interactive analytics dashboard tracking social media performance across Instagram, Facebook, and TikTok for data-driven marketing decisions.
Overview
Chargex, a growing technology microenterprise, needed a centralized solution to monitor social media performance across multiple platforms. I developed an interactive dashboard using Python and Streamlit that processes their social media data and delivers real-time insights for marketing optimization.
The Challenge
- Manual data collection from three different platforms (Instagram, Facebook, TikTok)
- Time-consuming spreadsheet updates leading to outdated insights
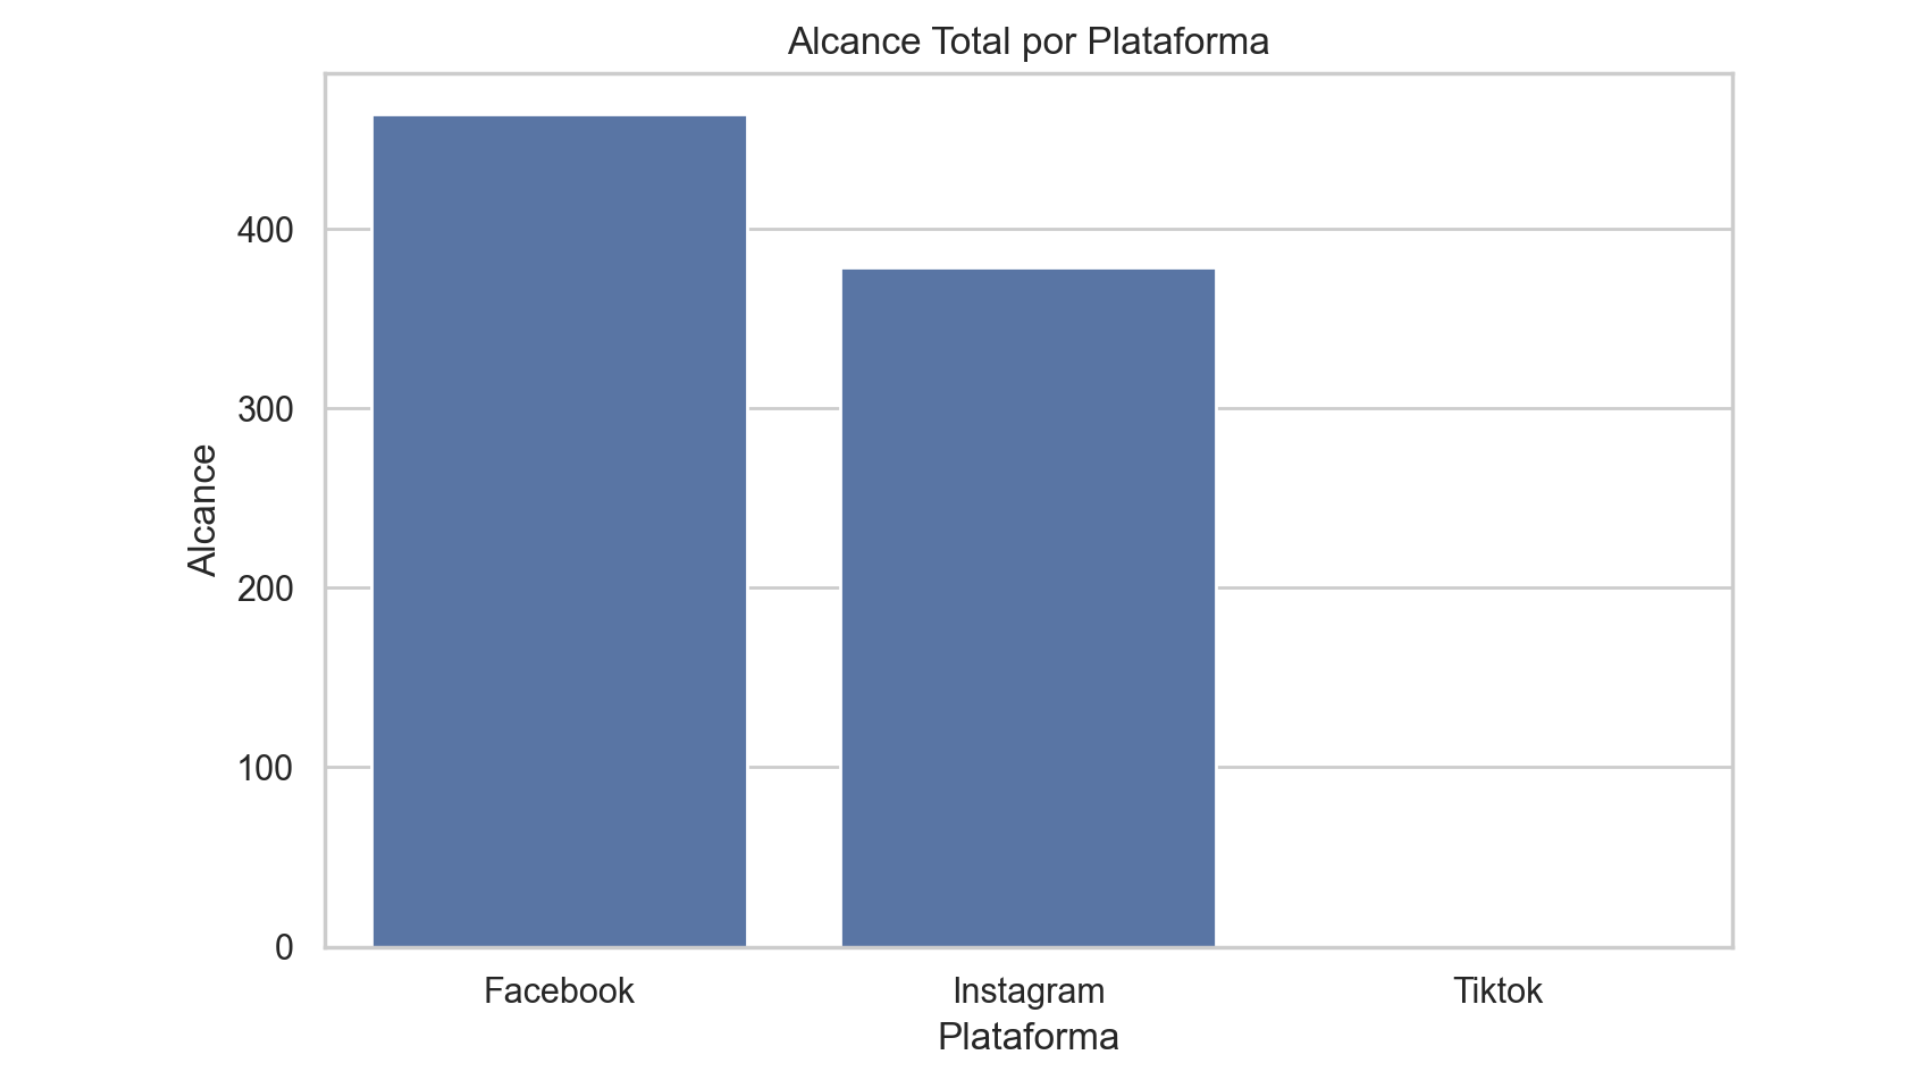
- Difficulty comparing performance across channels
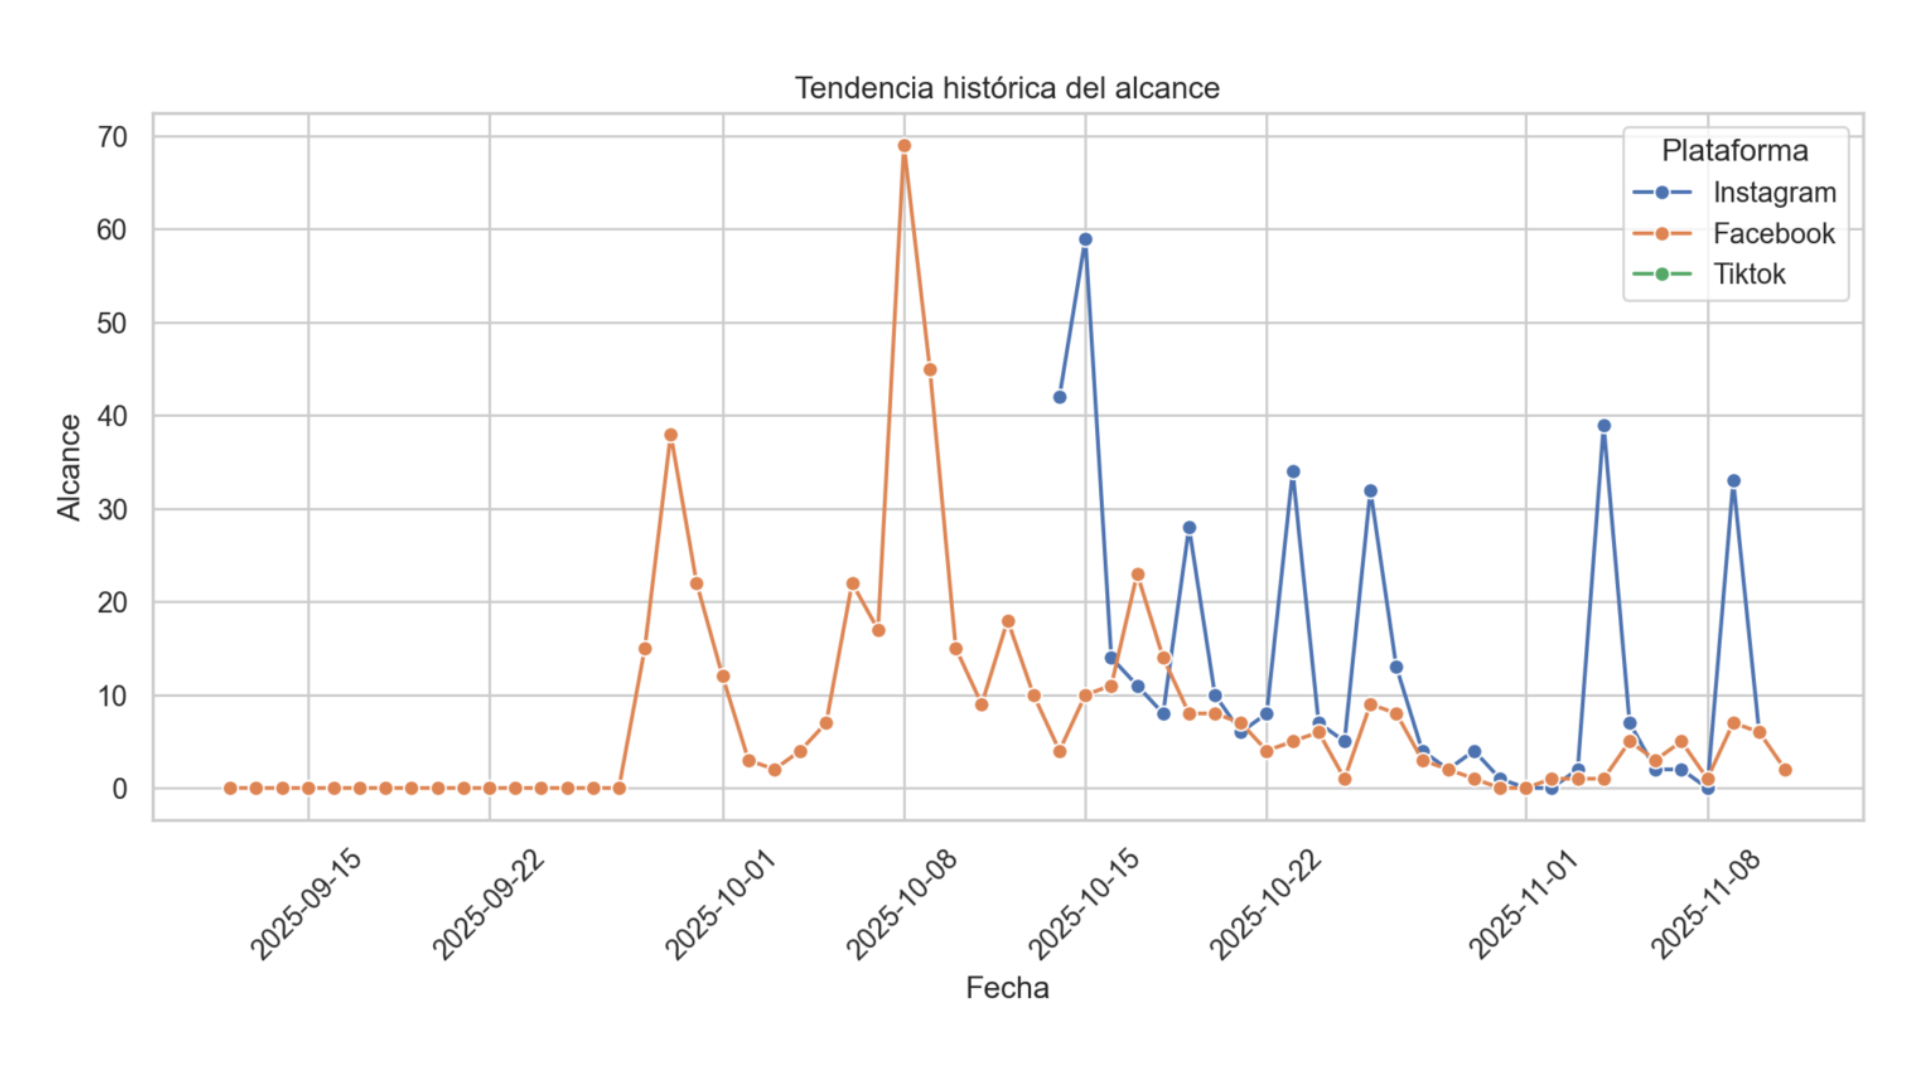
- No visualization of trends over time
Solution
- Multi-platform data integration into single dashboard view
- Key metrics tracking: engagement rate, reach, impressions, follower growth
- Interactive visualizations with time-based filtering
- Automated data processing and real-time updates
- Comparative analysis across platforms
Technologies Used
Results & Impact
The dashboard enabled Chargex to make faster, data-driven decisions about their social media strategy. The marketing team now identifies top-performing content types and optimal posting times in one centralized location.