Sales Analysis & Visualization
Python-based exploratory data analysis of sales data with statistical visualizations to identify patterns, trends, and business insights.
Overview
Conducted comprehensive exploratory data analysis on sales data using Python. The project focused on processing raw CSV data, identifying sales patterns, calculating descriptive statistics, and creating professional visualizations to communicate business insights.
The Challenge
- Raw sales data needed cleaning and transformation for analysis
- Stakeholders required clear visualization of sales trends
- Need to identify top-performing products and sales patterns
- Classify sales performance into meaningful ranges
Solution
- Loaded and cleaned sales data from CSV files using Pandas
- Performed exploratory data analysis to understand data distribution
- Calculated descriptive statistics (mean, median, standard deviation)
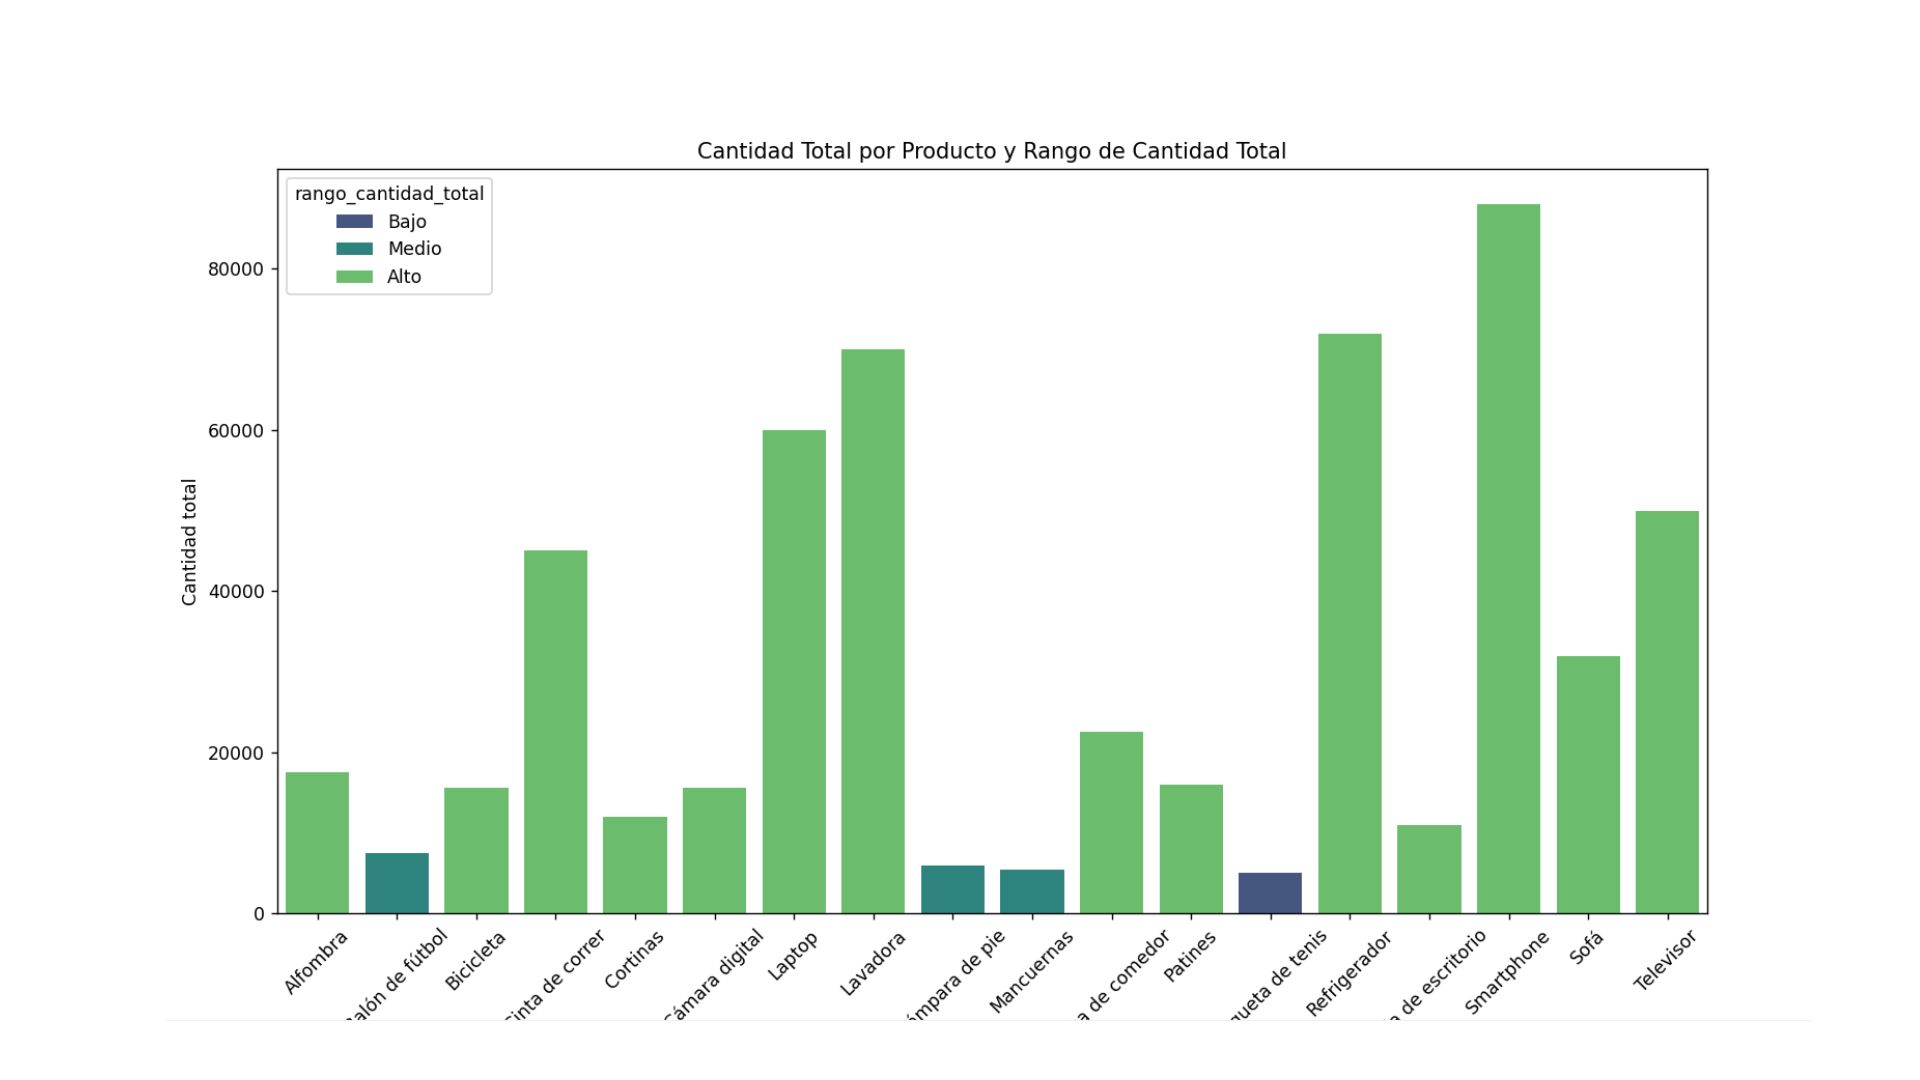
- Created visualizations: bar charts, line graphs, and distribution plots
- Identified sales patterns by product category and time period
- Classified products into performance ranges (high, medium, low)
Technologies Used
Key Deliverables
The analysis revealed clear patterns in sales performance, identifying which products drove the most revenue and which categories needed attention. Visual representations made complex data accessible to non-technical stakeholders.